Models

Code
# Packages
library(cmdstanr)
library(rstan)
library(scales)
library(knitr)
library(here)
library(janitor)
library(latex2exp)
library(distributional)
library(posterior)
library(patchwork)
library(tidybayes)
library(ggdist)
library(tidyverse)

# Some settings common to all modules
source(here("modules/_common.R"))

Bayesian inference

What is it?

  • “Bayesian inference is reallocation of credibility across possibilities.” (Kruschke 2014)
  • “Bayesian data analysis takes a question in the form of a model and uses logic to produce an answer in the form of probability distributions.” (McElreath 2020)
  • “Bayesian inference is the process of fitting a probability model to a set of data and summarizing the result by a probability distribution on the parameters of the model and on unobserved quantities such as predictions for new observations.” (Gelman et al. 2013)

What is it?

  • Bayesian inference consists of updating prior information, using evidence in data, to posterior information
  • Use probability distributions to express information (uncertainty)
Code
tibble(
  shape1 = c(3, 10, 13),
  shape2 = c(6, 4, 10),
  beta = dist_beta(shape1, shape2),
  name = factor(
    c("Prior", "Likelihood", "Posterior"),
    levels = c("Prior", "Likelihood", "Posterior"),
    labels =
      TeX(c("$p(\\theta)$", "$p(Y | \\theta)$", "$p(\\theta | Y)$"))
  )
) |>
  ggplot() +
  scale_color_brewer(
    palette = "Set1",
    labels = ~unname(
      TeX(c("$p(\\theta)$", "$p(Y | \\theta)$", "$p(\\theta | Y)$"))
    ),
    aesthetics = c("color", "fill")
  ) +
  scale_y_continuous(
    "Probability density",
    expand = expansion(c(0, .1))
  ) +
  scale_x_continuous(
    "Parameter value",
    expand = expansion(c(0.01, 0.01))
  ) +
  stat_slab(
    aes(xdist = beta, color = name),
    fill = NA,
    slab_linewidth = 1.5
  ) +
  theme(
    legend.title = element_blank(),
    axis.text.y = element_blank(),
    axis.ticks.y = element_blank(),
    legend.position = "right"
  )
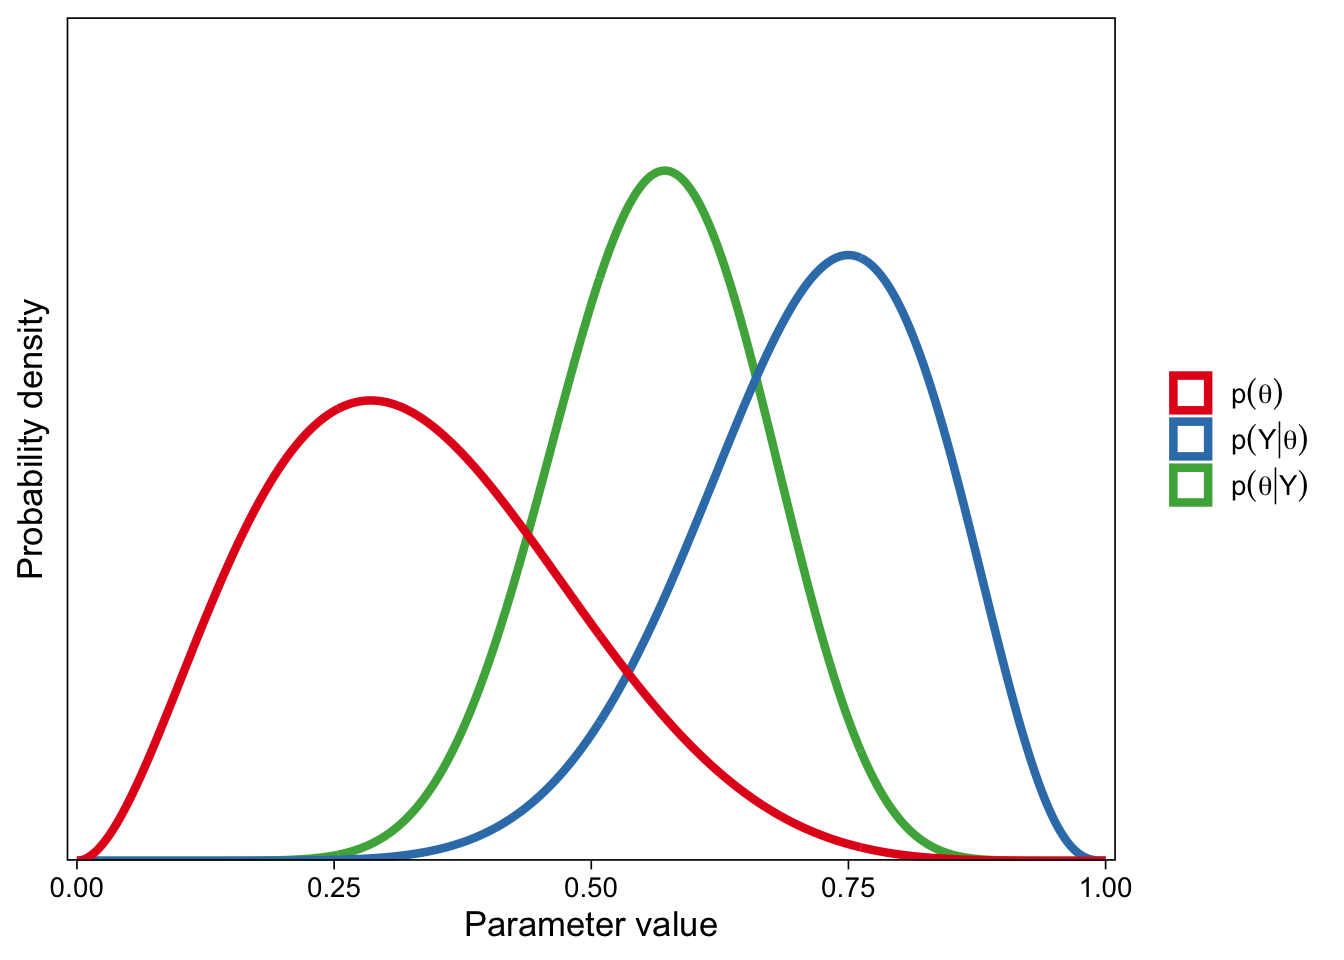
Figure 1: Bayesian inference combines prior information with data to produce a posterior distribution.

How is it different from what I already know?

  • Bayesian data analysis may not be that different from what you already know (i.e. orthodox / classical / frequentist statistics)
  • In the absence of strong prior information, and presence of large data, the same model evaluated in a Bayesian or orthodox framework will yield the same numerical answers
  • The interpretations of, and philosophies behind the numbers are vastly different
  • In many ways, orthodox statistical methods can be thought of approximations to Bayesian methods
  • Hypothesis tests are very different between the two frameworks
  • In practice, Bayesian statistics are an extremely flexible modelling framework

How is it different from what I already know?

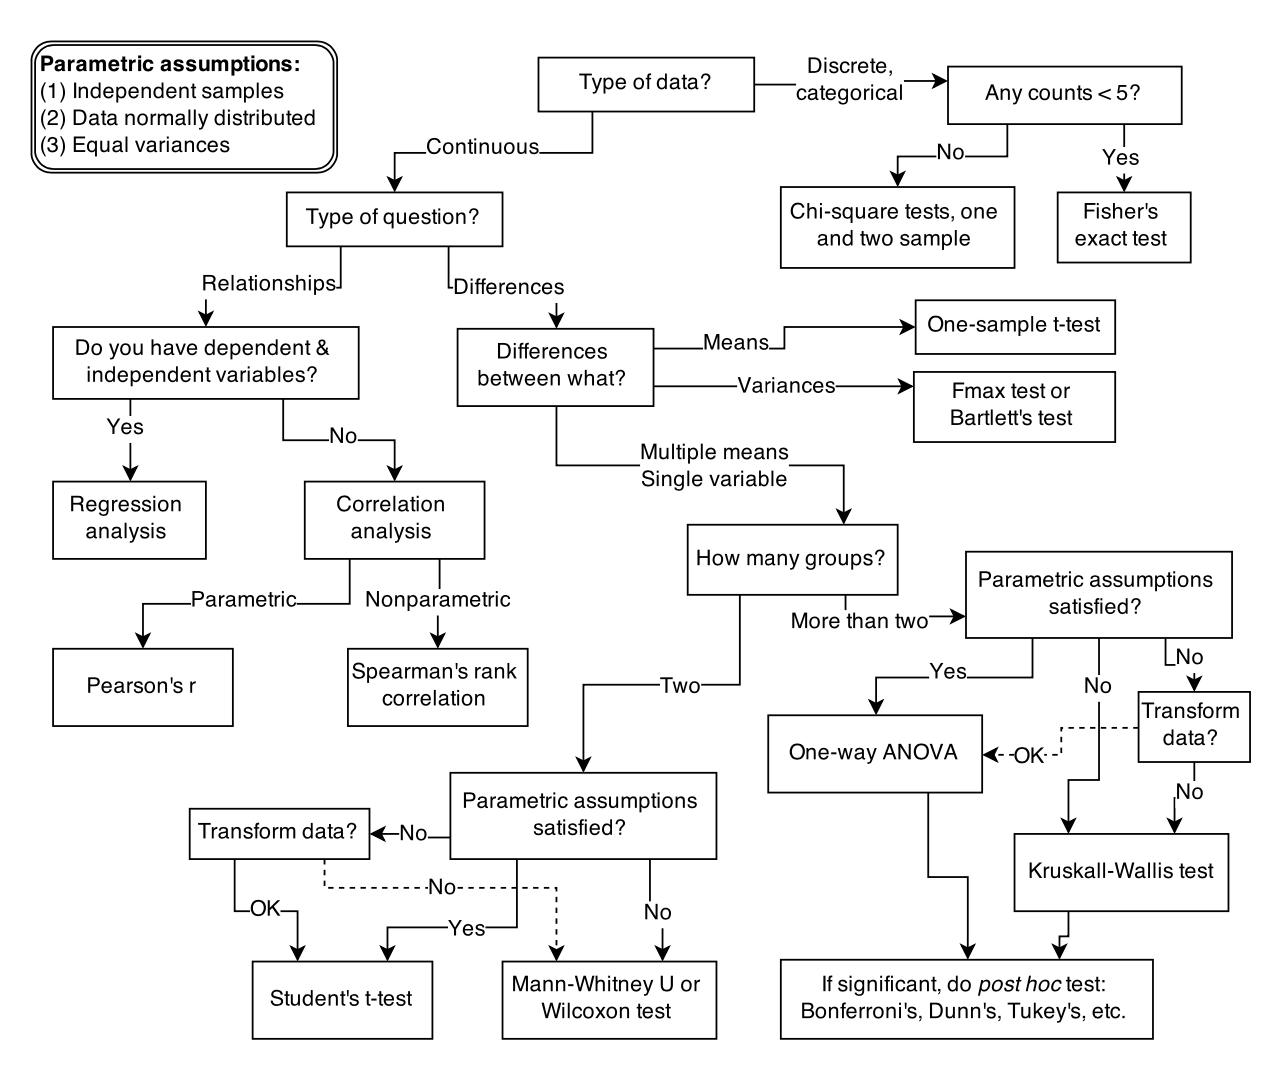
Figure 2: McElreath (2020): “Example decision tree, or flowchart, for selecting an appropriate statistical procedure. Beginning at the top, the user answers a series of questions about measurement and intent, arriving eventually at the name of a procedure. Many such decision trees are possible.”

What can it do for me?

You can estimate models in the Bayesian context that might not be otherwise possible. My first Bayesian analysis was conducted out of necessity. The model I wanted to use did not converge to a solution when I attempted to use orthodox methods (maximum likelihood estimation). Around the same time, I heard about Stan. I wrote some Stan code and the model converged without problems, and I was able to use the model that I wanted to.

With Bayes, you can actually be confident in your Confidence Intervals. I have a difficult time understanding p-values and Confidence Intervals. It can be difficult to understand what the uncertainty estimates mean when hypothetical replications are difficult to imagine in a given context. With a posterior distribution at hand, the corresponding probability values have a direct interpretation as credibility, uncertainty, or plausibility.

What can it do for me?

Bayesian methods allow easily carrying (un)certainty forward to other quantities of interest. It can often be difficult to obtain uncertainty estimates for various quantities when using orthodox methods. For example, effect size metrics are often reported without error bars (they can be obtained, but methods for doing so can be finicky and are not often used.)

To be sure, the Bayesian framework does not come for free. The methods might be difficult to communicate to others, at least until orthodox statistics are replaced in undergraduate applied statistics education. The necessity of complex computational algorithms makes it time-consuming—you will enjoy doing BDA more if you have a fast computer.

What can it do for me?

How can I do it?

In theory

  • What are the plausible values of parameters \(\theta\) after observing data?
  • The posterior distribution \(p(\theta \vert Y)\) is the answer
  • Bayes’ theorem describes how to compute this distribution

\[ p(\theta \vert Y) = \frac{p(Y \vert \theta) p(\theta)}{p(Y)} \]

  • \(p(Y \vert \theta)\): likelihood function
  • Probability of data given specific values for the model’s parameters
  • \(p(\theta)\): prior probability distribution on the parameters
  • How is plausibility distributed across possibilities before seeing data
  • \(p(Y)\): marginal likelihood of the data

\[ p(\theta \vert Y) \propto p(Y \vert \theta) p(\theta). \]

How can I do it?

In theory

\[ p(\theta \vert Y) \propto p(Y \vert \theta) p(\theta) \]

Need to specify how the likelihood of each data point contributes to the parameters’ overall probability:

\[ p(\theta \vert Y) \propto p(\theta) \prod^N_{n=1} p(y_i \vert \theta) \]

In terms of programming, we think of adding up the log probabilities of each observation:

\[ \text{log}\ p(\theta \vert Y) \propto \text{log}\ p(\theta) + \sum^N_{n=1} \text{log}\ p(y_i \vert \theta) \]

How can I do it?

Figure 4: Homo Bayesianis

How can I do it?

In practice

  • Target of inference is the posterior distribution
  • Many interesting models’ posterior distributions do not have solutions
  • Markov Chain Monte Carlo (MCMC) techniques allow us to approximate distributions by drawing random samples from them
  • BUGS, JAGS, PyMC, Stan

How can I do it?

In practice

Code
library(brms)
Figure 5: brms logo

Gaussian model

This section

  • Discuss a concise modeling workflow
  • Implement it in practice
  • A model with gaussian outcome and one continuous predictor
  • Establish notation following McElreath (2020)

Why models?

  • What is the role and goal of statistics in science?
  • We want to build models with parameters whose estimated magnitudes inform theories
  • We want to test hypothesized differences between means
  • Bayes allows us to use probability to quantify uncertainty about these parameters, and compare and criticize the models themselves

Bayesian workflow

To get started with BDA, it is useful to first informally define what a “Bayesian workflow” might look like. Following Kruschke (2014, 25), we identify five key data analysis steps

  1. Identify data relevant to the research question.
  2. Define a descriptive model, whose parameters capture the research question.
  3. Specify prior probability distributions on parameters in the model.
  4. Update the prior to a posterior distribution using Bayesian inference.
  5. Check your model against data, and identify possible problems.

Bayesian workflow

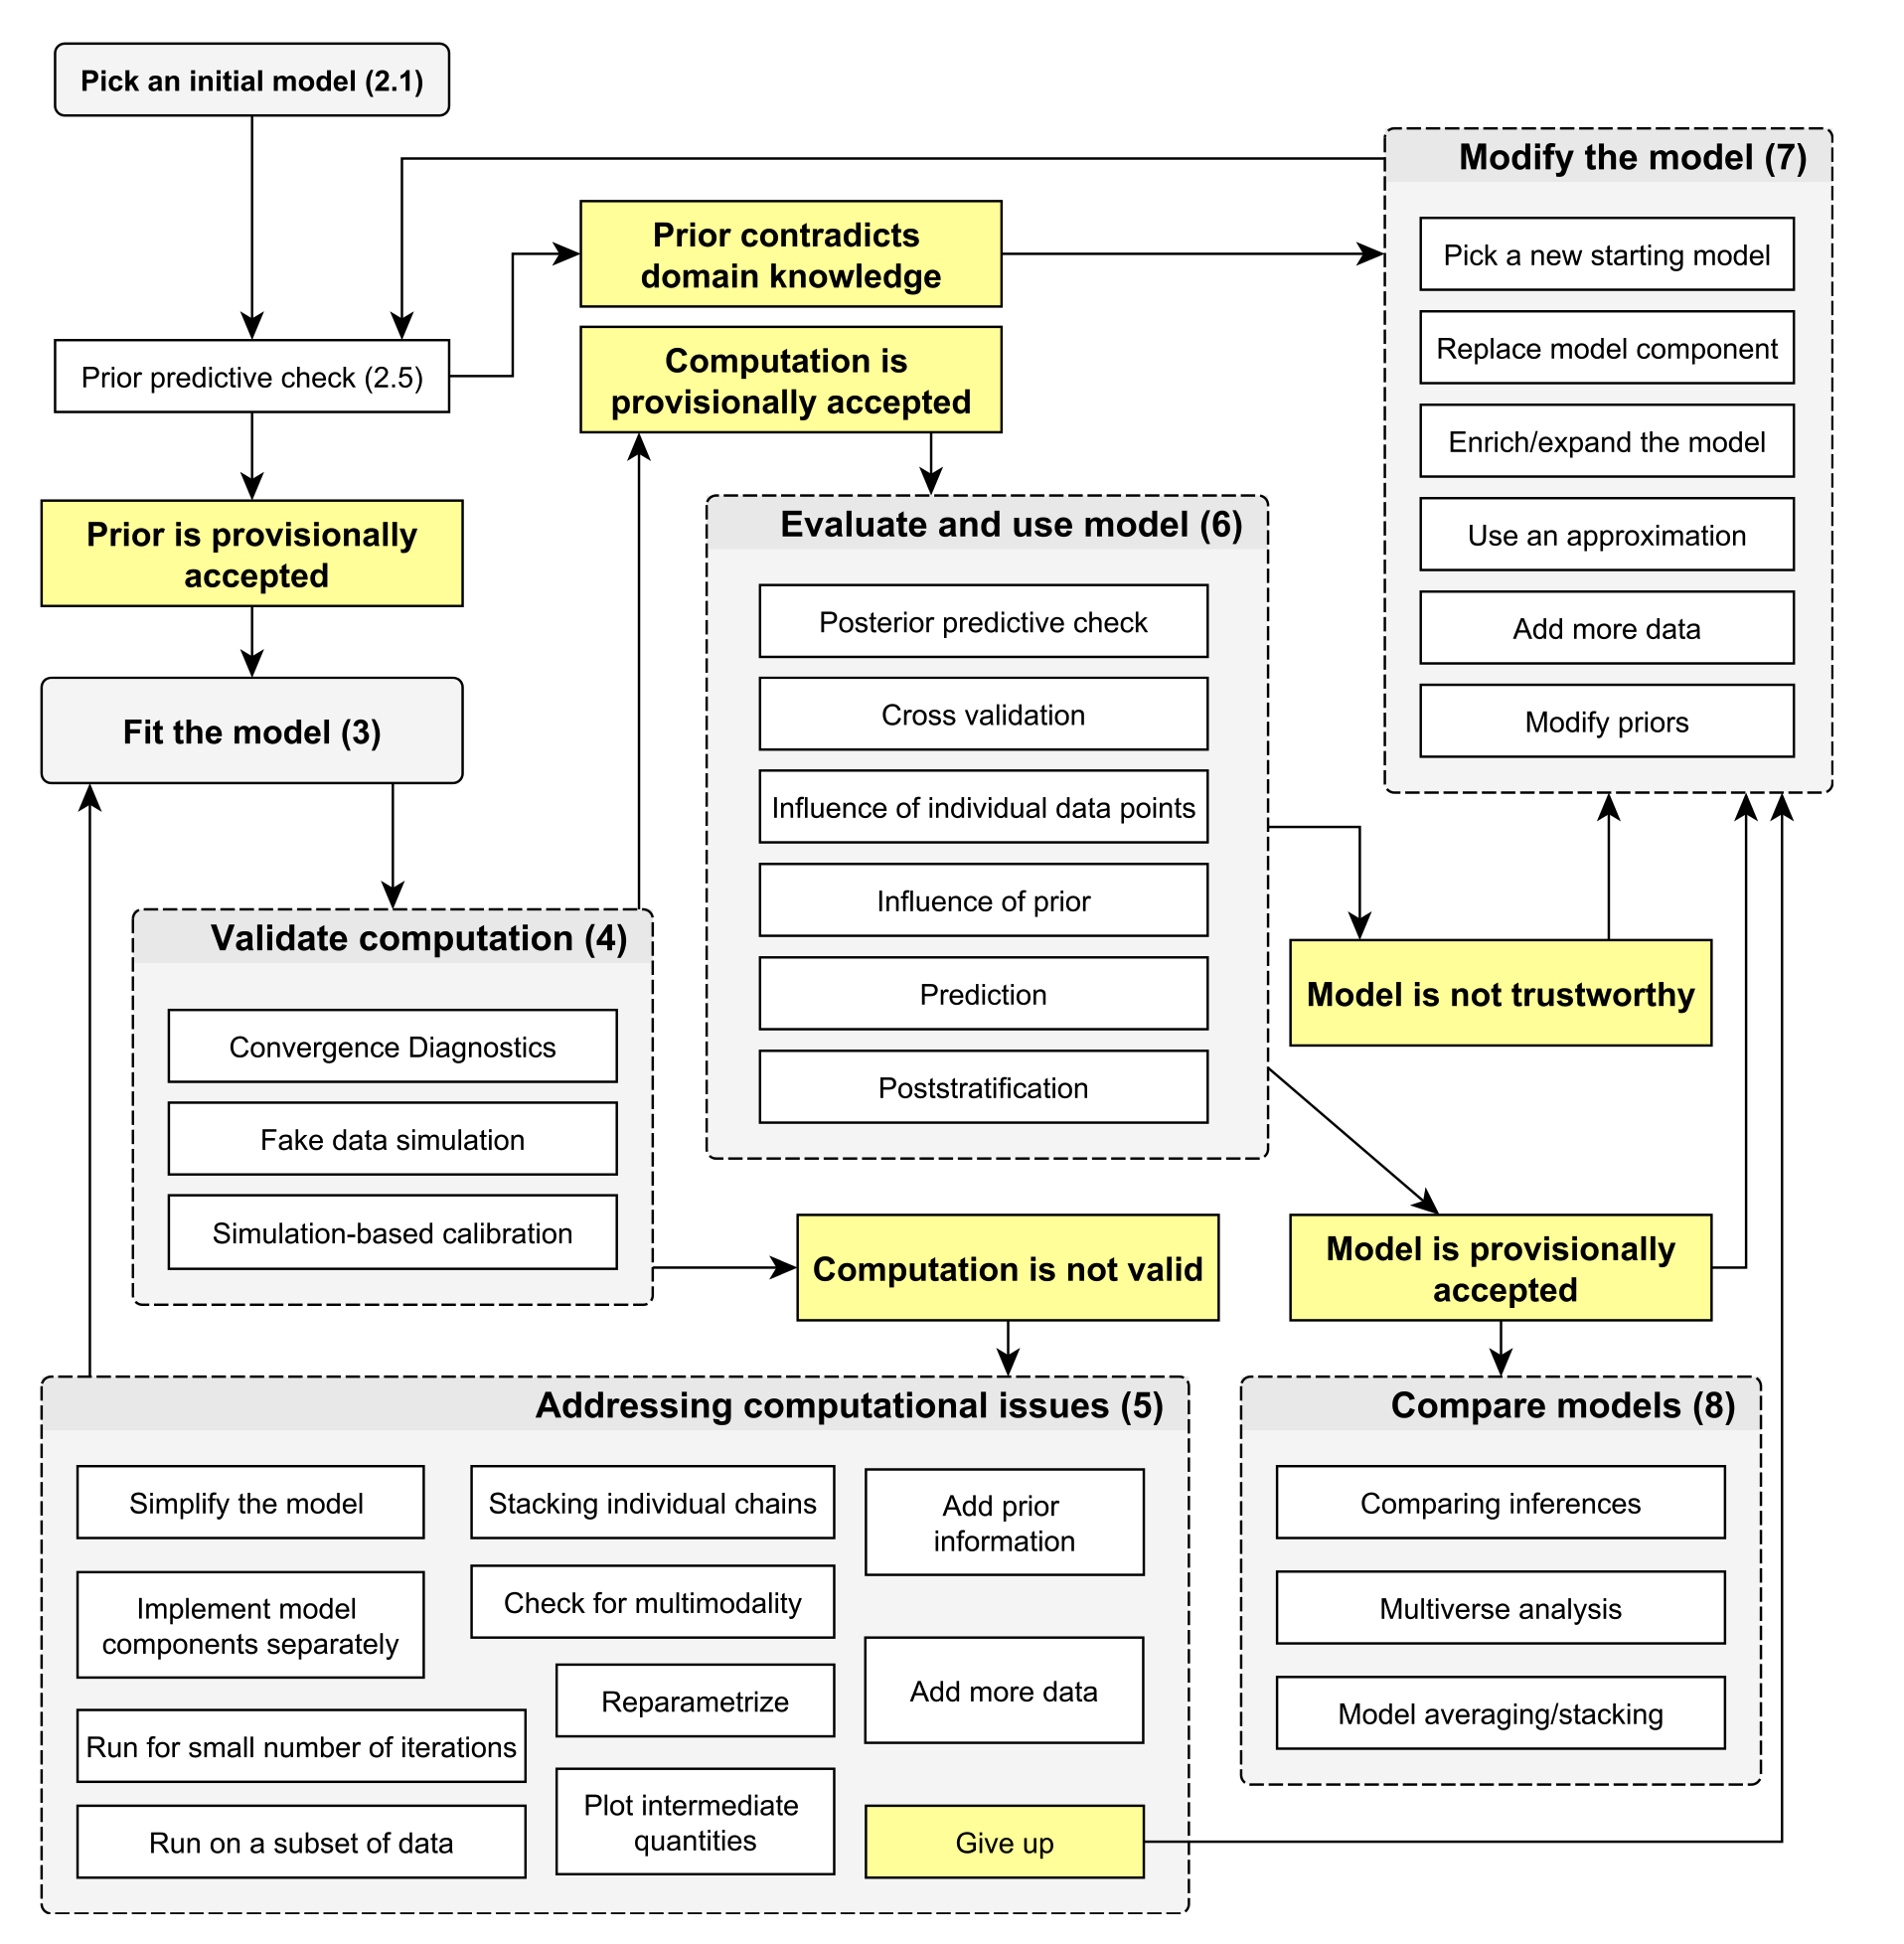
A more complete treatment is found in Gelman et al. (2020) (Figure 6).

Figure 6: Figure 1 from (Gelman et al. 2020): “Overview of the steps we currently consider in Bayesian workflow. Numbers in brackets refer to sections of this paper where the steps are discussed. The chart aims to show possible steps and paths an individual analysis may go through, with the understanding that any particular analysis will most likely not involve all of these steps. One of our goals in studying workflow is to understand how these ideas fit together so they can be applied more systematically.”

Identify relevant data

  1. (Research question, experimentation, measurement…)
  2. Define outcomes (DVs) and predictors (IVs)
  3. What are the scales? Were variables measured or manipulated? …

We collected data on the effects of sleep deprivation on cognitive performance, as measured by reaction time on a cognitive task. The data are observations of 18 individuals’ reaction times across 8 days of sleep deprivation (Table 1)

Code
dat <- tibble(lme4::sleepstudy) |>
  clean_names() |>
  # First two days (0 and 1) were an adaptation period
  filter(days >= 2) |>
  mutate(days = days - 2)
reaction days subject
251 0 308
321 1 308
357 2 308
415 3 308
382 4 308
290 5 308
Table 1: First six rows of sleep study data.

Identify relevant data

  • The way in which we ran this experiment (we didn’t!) would dictate, to a large extent, the variables and their roles in our analysis
  • There might be several other important variables to consider, such as how much a person typically sleeps, or whether they are trained on the cognitive task
  • Some or all of those variables might not exist in our data, but might guide our thinking nevertheless

Define a model

  • A creative process
  • Just because they are all wrong doesn’t mean you shouldn’t try to be less wrong
  • How are the outcomes distributed conditional on the predictors?
  • Are there natural bounds in the data? Are the data collected on a continuous or categorical scale?
  • What are the relations between variables? Are they linear or more complicated?
  • We will build a series of increasingly complex & informative models for these data

Define a model

  • “Null” model (no predictors)
  • We assume that the reaction times \(y_i\) in \(1, \dots, N\) are normally distributed with mean \(\mu\) and standard deviation \(\sigma\)

\[ y_i = \mu + \epsilon_i, \epsilon_i \sim Normal(0, \sigma^2) \]

We prefer the following “distributional” notation for its conciseness and emphasis on data rather than errors

\[ y_i \sim N(\mu, \sigma^2) \]

Code
bf0 <- bf(reaction ~ 1)

Prior distribution

  • A prior distribution is the distribution of plausible values a parameter can take, before the data are observed.
  • It is sometimes pointed at when critics claim that Bayesian statistics are subjective and therefore useless.
  • The prior distribution is only one part of a model chosen by the analyst.
  • Specifying priors requires care, and often a vague or even a prior that is constant over the parameter values can be a useful starting point.
  • We would be guided by our expert knowledge of this topic and design of the experiment

Prior distribution

For our first example, we let {brms} set default priors. These are weakly informative and only serve to facilitate model convergence.

Code
get_prior(bf0, dat)[,-c(3:7, 9)]
#>                      prior     class lb  source
#>  student_t(3, 303.2, 65.5) Intercept    default
#>      student_t(3, 0, 65.5)     sigma  0 default
Code
get_prior(bf0, dat) |>
  parse_dist() |>
  ggplot(aes(y = class)) +
  scale_x_continuous(
    "Parameter value",
    breaks = extended_breaks(7)
  ) +
  stat_halfeye(
    aes(xdist = .dist_obj)
  ) +
  theme(
    axis.title.y = element_blank()
  )

Prior distribution

  • If you wish to “let the data speak for itself”, the prior can be set to a constant over the possible values of the parameter.
  • Whether such a noninformative or flat prior leads to a “Bayesian” analysis is, however, debatable.
  • Currently, so called weakly informative priors are popular, because they help prevent certain computational issues in sampling from the model’s posterior distribution, while remaining mostly uninformative about the parameter values.
  • Informative priors have a substantial impact on the posterior distribution
  • Useful when strong prior information is available
  • Required for hypothesis testing (e.g. Bayes factors)
  • It is OK to start with a noninformative prior, but you will likely be able to tell how implausible such a starting point can be with further thought & simulation.
  • Kruschke suggests that a prior should be chosen such that you could defend it in front of a sceptical audience
  • Choosing priors vs. likelihood functions

Sampling from the posterior with brm()

Code
fit0 <- brm(
  formula = reaction ~ 1,
  family = gaussian(), 
  data = dat,
  file = here("models/introduction-0")
)

Sampling from the posterior with brm()

Use environment variables to separate settings from source code.

.Renviron
MAX_CORES = 8
BRMS_BACKEND = "cmdstanr"
BRMS_THREADS = 2

Refer to environment variables when setting default HMC sampler options

_common.R
options(
  brms.backend = Sys.getenv("BRMS_BACKEND", "rstan"),
  brms.threads = as.numeric(Sys.getenv("BRMS_THREADS"), 1),
  mc.cores = as.numeric(Sys.getenv("MAX_CORES"), 4)
)

brm() uses options() for several arguments (see ?brm).

cmdstanr

Model checking

Estimation relies on computational algorithms that can fail to deliver. This is unlikely with gaussian and other simple models, but checking should be done nevertheless.

Code
plot(fit0)

Model checking

More checking, and interpreting quantities.

Code
summary(fit0)
#>  Family: gaussian 
#>   Links: mu = identity; sigma = identity 
#> Formula: reaction ~ 1 
#>    Data: dat (Number of observations: 144) 
#>   Draws: 4 chains, each with iter = 2000; warmup = 1000; thin = 1;
#>          total post-warmup draws = 4000
#> 
#> Regression Coefficients:
#>           Estimate Est.Error l-95% CI u-95% CI Rhat Bulk_ESS Tail_ESS
#> Intercept   307.86      4.85   298.39   317.67 1.00     3427     2112
#> 
#> Further Distributional Parameters:
#>       Estimate Est.Error l-95% CI u-95% CI Rhat Bulk_ESS Tail_ESS
#> sigma    57.33      3.36    51.14    64.35 1.00     3259     2616
#> 
#> Draws were sampled using sample(hmc). For each parameter, Bulk_ESS
#> and Tail_ESS are effective sample size measures, and Rhat is the potential
#> scale reduction factor on split chains (at convergence, Rhat = 1).

Posterior predictive check

Once a posterior distribution is obtained, it is prudent to check whether it makes reasonable predictions; if it “fits the data” well. This is sometimes called posterior predictive checking, because we use the posterior to generate predictions that are then checked against data. These checks can focus on the overall “fit” of the model…

Code
pp_check(fit0, type = "hist", nsamples = 5) +
  scale_x_continuous("Reaction time (ms)")

Posterior predictive check

…or focus on particular aspects of the data, such as the mean and sd

Code
pp_check(fit0, type = "stat_2d", stat = c("mean", "sd"))

Posterior predictive check

…or some other summaries

Code

pp_check(fit0, type = "stat_2d", stat = c("min", "max"))

Gaussian model with predictor

Model 2

  • The previous was a “null” model; did not include predictors
  • What is the effect of one day of sleep deprivation on reaction time

\[ y_i \sim N(\beta_0 + \beta_1 x_i, \sigma^2), \]

  • \(\beta_0\) is the intercept
  • \(\beta_1\) is the coefficient of days, \(x_i\).
  • \(\sigma\) is the residual standard deviation
Code
bf1 <- bf(reaction ~ days)

Priors

Code
get_prior(bf1, dat)[,-c(3:7, 9)]
#>                      prior     class lb  source
#>                     (flat)         b    default
#>  student_t(3, 303.2, 65.5) Intercept    default
#>      student_t(3, 0, 65.5)     sigma  0 default
p <- prior(student_t(7, 300, 200), class = "Intercept") +
  prior(student_t(7, 0, 100), class = "b", coef = "days") +
  prior(student_t(7, 0, 50), class = "sigma", lb = 0)
p[,-c(3:7, 9)]
#>                   prior     class   lb source
#>  student_t(7, 300, 200) Intercept <NA>   user
#>    student_t(7, 0, 100)         b <NA>   user
#>     student_t(7, 0, 50)     sigma    0   user

Sample from the posterior

Code
fit1 <- brm(
  bf1,
  family = gaussian(),
  data = dat,
  prior = p,
  sample_prior = "yes",
  # file = here("models/introduction-1")
)
#> Running MCMC with 4 chains, at most 8 in parallel, with 2 thread(s) per chain...
#> 
#> Chain 1 Iteration:   1 / 1000 [  0%]  (Warmup) 
#> Chain 1 Iteration: 100 / 1000 [ 10%]  (Warmup) 
#> Chain 1 Iteration: 200 / 1000 [ 20%]  (Warmup) 
#> Chain 1 Iteration: 300 / 1000 [ 30%]  (Warmup) 
#> Chain 1 Iteration: 400 / 1000 [ 40%]  (Warmup) 
#> Chain 1 Iteration: 500 / 1000 [ 50%]  (Warmup) 
#> Chain 1 Iteration: 501 / 1000 [ 50%]  (Sampling) 
#> Chain 1 Iteration: 600 / 1000 [ 60%]  (Sampling) 
#> Chain 1 Iteration: 700 / 1000 [ 70%]  (Sampling) 
#> Chain 1 Iteration: 800 / 1000 [ 80%]  (Sampling) 
#> Chain 1 Iteration: 900 / 1000 [ 90%]  (Sampling) 
#> Chain 1 Iteration: 1000 / 1000 [100%]  (Sampling) 
#> Chain 2 Iteration:   1 / 1000 [  0%]  (Warmup) 
#> Chain 3 Iteration:   1 / 1000 [  0%]  (Warmup) 
#> Chain 3 Iteration: 100 / 1000 [ 10%]  (Warmup) 
#> Chain 3 Iteration: 200 / 1000 [ 20%]  (Warmup) 
#> Chain 3 Iteration: 300 / 1000 [ 30%]  (Warmup) 
#> Chain 3 Iteration: 400 / 1000 [ 40%]  (Warmup) 
#> Chain 3 Iteration: 500 / 1000 [ 50%]  (Warmup) 
#> Chain 3 Iteration: 501 / 1000 [ 50%]  (Sampling) 
#> Chain 3 Iteration: 600 / 1000 [ 60%]  (Sampling) 
#> Chain 3 Iteration: 700 / 1000 [ 70%]  (Sampling) 
#> Chain 3 Iteration: 800 / 1000 [ 80%]  (Sampling) 
#> Chain 3 Iteration: 900 / 1000 [ 90%]  (Sampling) 
#> Chain 3 Iteration: 1000 / 1000 [100%]  (Sampling) 
#> Chain 4 Iteration:   1 / 1000 [  0%]  (Warmup) 
#> Chain 1 finished in 0.1 seconds.
#> Chain 3 finished in 0.1 seconds.
#> Chain 2 Iteration: 100 / 1000 [ 10%]  (Warmup) 
#> Chain 2 Iteration: 200 / 1000 [ 20%]  (Warmup) 
#> Chain 2 Iteration: 300 / 1000 [ 30%]  (Warmup) 
#> Chain 2 Iteration: 400 / 1000 [ 40%]  (Warmup) 
#> Chain 2 Iteration: 500 / 1000 [ 50%]  (Warmup) 
#> Chain 2 Iteration: 501 / 1000 [ 50%]  (Sampling) 
#> Chain 2 Iteration: 600 / 1000 [ 60%]  (Sampling) 
#> Chain 2 Iteration: 700 / 1000 [ 70%]  (Sampling) 
#> Chain 2 Iteration: 800 / 1000 [ 80%]  (Sampling) 
#> Chain 2 Iteration: 900 / 1000 [ 90%]  (Sampling) 
#> Chain 2 Iteration: 1000 / 1000 [100%]  (Sampling) 
#> Chain 4 Iteration: 100 / 1000 [ 10%]  (Warmup) 
#> Chain 4 Iteration: 200 / 1000 [ 20%]  (Warmup) 
#> Chain 4 Iteration: 300 / 1000 [ 30%]  (Warmup) 
#> Chain 4 Iteration: 400 / 1000 [ 40%]  (Warmup) 
#> Chain 4 Iteration: 500 / 1000 [ 50%]  (Warmup) 
#> Chain 4 Iteration: 501 / 1000 [ 50%]  (Sampling) 
#> Chain 4 Iteration: 600 / 1000 [ 60%]  (Sampling) 
#> Chain 4 Iteration: 700 / 1000 [ 70%]  (Sampling) 
#> Chain 4 Iteration: 800 / 1000 [ 80%]  (Sampling) 
#> Chain 4 Iteration: 900 / 1000 [ 90%]  (Sampling) 
#> Chain 4 Iteration: 1000 / 1000 [100%]  (Sampling) 
#> Chain 2 finished in 0.2 seconds.
#> Chain 4 finished in 0.2 seconds.
#> 
#> All 4 chains finished successfully.
#> Mean chain execution time: 0.2 seconds.
#> Total execution time: 0.4 seconds.

Model checking

Code
summary(fit1)
#>  Family: gaussian 
#>   Links: mu = identity; sigma = identity 
#> Formula: reaction ~ days 
#>    Data: dat (Number of observations: 144) 
#>   Draws: 4 chains, each with iter = 1000; warmup = 500; thin = 1;
#>          total post-warmup draws = 2000
#> 
#> Regression Coefficients:
#>           Estimate Est.Error l-95% CI u-95% CI Rhat Bulk_ESS Tail_ESS
#> Intercept   268.12      7.80   253.36   283.35 1.00     1942     1363
#> days         11.41      1.86     7.80    15.00 1.00     2063     1650
#> 
#> Further Distributional Parameters:
#>       Estimate Est.Error l-95% CI u-95% CI Rhat Bulk_ESS Tail_ESS
#> sigma    51.11      3.02    45.34    57.49 1.00     2036     1378
#> 
#> Draws were sampled using sample(hmc). For each parameter, Bulk_ESS
#> and Tail_ESS are effective sample size measures, and Rhat is the potential
#> scale reduction factor on split chains (at convergence, Rhat = 1).

Model checking

Code
plot(fit1)

Posterior predictive check

Code
pp_check(fit1, type = "stat_2d", stat = c("min", "max"))

  • What is happening?
Code
pp_check(fit1)

Posterior predictive check

Code
set.seed(1)
p1 <- dat |>
  ggplot(aes(days, reaction)) +
  scale_x_continuous(breaks = pretty_breaks(9)) +
  scale_y_continuous(breaks = pretty_breaks(5)) +
  labs(
    x = "days of sleep deprivation", 
    y = "RT"
  )

tmp <- spread_draws(
  fit1,
  prior_Intercept, prior_b_days,
  ndraws = 30
) |>
  crossing(dat) |>
  rowwise() |>
  mutate(
    .value = prior_Intercept + prior_b_days * days
  )

p2 <- p1 %+%
  tmp +
  aes(y = .value, group = .draw) +
  geom_line(alpha = .05) +
  labs(
    x = "days of sleep deprivation", 
    y = "Prior predicted mean RT"
  )

p3 <- p2 %+%
  add_epred_draws(dat, fit1, ndraws = 30) +
  aes(y = .epred) +
  labs(
    x = "days of sleep deprivation", 
    y = "Posterior predicted mean RT"
  )

(p2 | p1 + geom_point() | p3) & 
  coord_cartesian(ylim = c(-500, 1000))

Summarising the posterior distribution

Code
gather_draws(fit1, b_Intercept, b_days, sigma) |>
  ggplot(aes(y = .variable, x = .value)) +
  stat_histinterval(breaks = 50) +
  scale_x_continuous("Parameter value") +
  theme(axis.title.y = element_blank())

Let’s write a function to report useful numbers

Code
sm <- \(
  x, 
  v = c("^b_", "^sd_", "^cor_", "^sigma"), 
  r = TRUE
) {
  as_draws_df(x, variable = v, regex = r) |> 
    summarise_draws(
      mean, sd, 
      ~quantile2(.x, c(0.025, 0.975)),
      pd = ~Pr(sign(.x) == sign(median(.x))),
      rhat, ess_tail
    )
}
sm(fit1)
#> # A tibble: 3 × 8
#>   variable     mean    sd   q2.5 q97.5    pd  rhat ess_tail
#>   <chr>       <dbl> <dbl>  <dbl> <dbl> <dbl> <dbl>    <dbl>
#> 1 b_Intercept 268.   7.80 253.   283.      1  1.00    1363.
#> 2 b_days       11.4  1.86   7.80  15.0     1  1.00    1650.
#> 3 sigma        51.1  3.02  45.3   57.5     1  1.00    1378.
Code
sm(fit1) |> 
  mutate(
    `95%CI` = str_glue(
      "[{number(q2.5, .01)}, {number(q97.5, .01)}]"
    ),
    .after = 3
  ) |> 
  select(
    -starts_with("q")
  ) |> 
  kable()
variable mean sd 95%CI pd rhat ess_tail
b_Intercept 268 7.8 [253.36, 283.35] 1 1 1363
b_days 11 1.9 [7.80, 15.00] 1 1 1650
sigma 51 3.0 [45.34, 57.49] 1 1 1378

Meet the S x P matrix

Code
post <- as_draws_df(fit1)
post[,1:6]
#> # A tibble: 2,000 × 6
#>    b_Intercept b_days sigma Intercept prior_Intercept prior_b_days
#>          <dbl>  <dbl> <dbl>     <dbl>           <dbl>        <dbl>
#>  1        266.  12.9   52.1      311.           365.        -72.5 
#>  2        259.  14.4   51.2      309.           307.        -32.7 
#>  3        264.  11.8   49.9      306.            49.2      -163.  
#>  4        268.   9.91  50.2      303.           777.         84.7 
#>  5        269.  10.9   52.1      307.           367.        -65.0 
#>  6        262.  13.0   47.2      307.           363.         90.3 
#>  7        267.  10.8   56.5      305.           196.       -258.  
#>  8        260.  14.0   49.4      309.           251.         -4.66
#>  9        265.  11.7   45.0      306.           143.        -17.1 
#> 10        275.  11.0   53.6      313.           419.        118.  
#> # ℹ 1,990 more rows
Code
post$qoi <- post$b_days / post$sigma
sm(post)
#> # A tibble: 10 × 8
#>    variable            mean       sd     q2.5    q97.5    pd  rhat ess_tail
#>    <chr>              <dbl>    <dbl>    <dbl>    <dbl> <dbl> <dbl>    <dbl>
#>  1 b_Intercept      268.      7.80    253.     283.    1      1.00    1363.
#>  2 b_days            11.4     1.86      7.80    15.0   1      1.00    1650.
#>  3 sigma             51.1     3.02     45.3     57.5   1      1.00    1378.
#>  4 Intercept        308.      4.17    300.     316.    1      1.00    1396.
#>  5 prior_Intercept  303.    229.     -145.     764.    0.914  1.00    2004.
#>  6 prior_b_days      -2.77  118.     -239.     242.    0.517  1.00    1889.
#>  7 prior_sigma       45.1    38.0       2.39   140.    1      1.00    1821.
#>  8 lprior           -16.6     0.0619  -16.7    -16.4   1      1.00    1397.
#>  9 lp__            -783.      1.23   -786.    -782.    1      1.00    1144.
#> 10 qoi                0.224   0.0385    0.149    0.298 1      1.00    1506.

Posterior predictive check

Code
pp_check(fit1, nsamples = 30)

Posterior predictive check

Code
pp_check(fit1, type = "stat_2d", stat = c("min", "max"))

Conditional effects

Code
plot(
  conditional_effects(fit1, "days"), 
  points = TRUE
)

  • Perhaps we should model variance on days?

Location-scale model

Location-scale model

\[ \begin{aligned} y_i &\sim N(\mu, \sigma^2), \\ \mu &= \beta_0 + \beta_1 x_i, \\ \sigma &= \text{exp}(\gamma_0 + \gamma_1x_1). \end{aligned} \]

Code
bf2 <- bf(reaction ~ days) + lf(sigma ~ days)

get_prior(bf2, dat)[,c(1:3, 6, 10)]
#>                      prior     class coef  dpar  source
#>                     (flat)         b            default
#>                     (flat)         b days       default
#>  student_t(3, 303.2, 65.5) Intercept            default
#>                     (flat)         b      sigma default
#>                     (flat)         b days sigma default
#>       student_t(3, 0, 2.5) Intercept      sigma default

Location-scale model

Code
fit2 <- brm(
  bf2,
  data = dat,
  control = list(adapt_delta = .95),
  file = here("models/introduction-2")
)

By the way this is equivalent to

#| echo: true

fit2 <- brm(
  bf(reaction ~ days, sigma ~ days),
  data = dat
)

Summarising the posterior distribution

Code
summary(fit2)
#>  Family: gaussian 
#>   Links: mu = identity; sigma = log 
#> Formula: reaction ~ days 
#>          sigma ~ days
#>    Data: sleepstudy (Number of observations: 144) 
#>   Draws: 4 chains, each with iter = 2000; warmup = 1000; thin = 1;
#>          total post-warmup draws = 4000
#> 
#> Regression Coefficients:
#>                 Estimate Est.Error l-95% CI u-95% CI Rhat Bulk_ESS Tail_ESS
#> sigma_Intercept     3.54      0.12     3.32     3.77 1.00     2623     2686
#> Intercept         267.56      6.02   255.57   279.44 1.00     1836     2143
#> days               11.57      1.83     8.03    15.26 1.00     1907     2411
#> sigma_days          0.10      0.03     0.05     0.16 1.00     2638     2387
#> 
#> Draws were sampled using sample(hmc). For each parameter, Bulk_ESS
#> and Tail_ESS are effective sample size measures, and Rhat is the potential
#> scale reduction factor on split chains (at convergence, Rhat = 1).

Summarising the posterior distribution

Code
fit2 |>
  gather_draws(b_days, b_sigma_days) |>
  ggplot(aes(.value, .variable)) +
  stat_histinterval()

Model comparison

Code
# Add LOO criteria to all models
fit0 <- add_criterion(fit0, "loo")
fit1 <- add_criterion(fit1, "loo")
fit2 <- add_criterion(fit2, "loo")
Code
loo(fit0)
#> 
#> Computed from 4000 by 144 log-likelihood matrix.
#> 
#>          Estimate   SE
#> elpd_loo   -788.2  8.3
#> p_loo         1.9  0.4
#> looic      1576.5 16.6
#> ------
#> MCSE of elpd_loo is 0.0.
#> MCSE and ESS estimates assume MCMC draws (r_eff in [0.7, 0.9]).
#> 
#> All Pareto k estimates are good (k < 0.7).
#> See help('pareto-k-diagnostic') for details.

elpd_loo is the Bayesian LOO estimate of the expected log pointwise predictive density (Eq 4 in VGG2017) and is a sum of N individual pointwise log predictive densities. Probability densities can be smaller or larger than 1, and thus log predictive densities can be negative or positive. For simplicity the ELPD acronym is used also for expected log pointwise predictive probabilities for discrete models. Probabilities are always equal or less than 1, and thus log predictive probabilities are 0 or negative.

Code
loo_compare(
  fit0, fit1, fit2
)
#>      elpd_diff se_diff
#> fit2   0.0       0.0  
#> fit1  -5.9       3.3  
#> fit0 -22.0       6.1

elpd_diff is the difference in elpd_loo for two models. If more than two models are compared, the difference is computed relative to the model with highest elpd_loo.

As quick rule: If elpd difference (elpd_diff in loo package) is less than 4, the difference is small (Sivula, Magnusson and Vehtari, 2020, p. McLatchie+etal:2023). If elpd difference (elpd_diff in loo package) is larger than 4, then compare that difference to standard error of elpd_diff (provided e.g. by loo package) (Sivula, Magnusson and Vehtari, 2020).

  • Sometimes Theory > model comparison

Non-gaussian model

Why

Code
dat |> 
  ggplot(aes(days, reaction)) +
  geom_point() +
  geom_smooth(method = "loess")

Reaction time data

Code
fitrt1 <- brm(
  bf(reaction ~ days) + shifted_lognormal(),
  data = dat,
  control = list(adapt_delta = .95),
  file = here("models/introduction-sln-1")
)
fitrt1 <- add_criterion(fitrt1, "loo")
loo_compare(fit1, fitrt1)
#>        elpd_diff se_diff
#> fitrt1  0.0       0.0   
#> fit1   -1.0       2.6
Code
summary(fitrt1)
#>  Family: shifted_lognormal 
#>   Links: mu = identity; sigma = identity; ndt = identity 
#> Formula: reaction ~ days 
#>    Data: dat (Number of observations: 144) 
#>   Draws: 4 chains, each with iter = 2000; warmup = 1000; thin = 1;
#>          total post-warmup draws = 4000
#> 
#> Regression Coefficients:
#>           Estimate Est.Error l-95% CI u-95% CI Rhat Bulk_ESS Tail_ESS
#> Intercept     5.29      0.20     4.86     5.58 1.00      635     1043
#> days          0.05      0.01     0.03     0.07 1.00      951     1159
#> 
#> Further Distributional Parameters:
#>       Estimate Est.Error l-95% CI u-95% CI Rhat Bulk_ESS Tail_ESS
#> sigma     0.22      0.04     0.16     0.32 1.00      692     1169
#> ndt      64.79     37.38     3.50   134.98 1.01      642      948
#> 
#> Draws were sampled using sample(hmc). For each parameter, Bulk_ESS
#> and Tail_ESS are effective sample size measures, and Rhat is the potential
#> scale reduction factor on split chains (at convergence, Rhat = 1).
Code
plot(conditional_effects(fitrt1), points = TRUE)

Code
pp_check(fitrt1)

Model variance too

Code
fitrt2 <- brm(
  bf(reaction ~ days) + 
    lf(sigma ~ days) +
    shifted_lognormal(),
  data = dat,
  control = list(adapt_delta = .95),
  file = here("models/introduction-sln-2")
)
fitrt2 <- add_criterion(fitrt2, "loo")
loo_compare(fitrt1, fitrt2)
#>        elpd_diff se_diff
#> fitrt2  0.0       0.0   
#> fitrt1 -2.2       2.2
Code
summary(fitrt2)
#>  Family: shifted_lognormal 
#>   Links: mu = identity; sigma = log; ndt = identity 
#> Formula: reaction ~ days 
#>          sigma ~ days
#>    Data: dat (Number of observations: 144) 
#>   Draws: 4 chains, each with iter = 2000; warmup = 1000; thin = 1;
#>          total post-warmup draws = 4000
#> 
#> Regression Coefficients:
#>                 Estimate Est.Error l-95% CI u-95% CI Rhat Bulk_ESS Tail_ESS
#> Intercept           5.39      0.16     5.00     5.59 1.00      741     1076
#> sigma_Intercept    -1.86      0.20    -2.19    -1.42 1.00      884     1110
#> days                0.04      0.01     0.03     0.07 1.00      980     1098
#> sigma_days          0.07      0.03     0.01     0.12 1.00     1904     2113
#> 
#> Further Distributional Parameters:
#>     Estimate Est.Error l-95% CI u-95% CI Rhat Bulk_ESS Tail_ESS
#> ndt    45.91     32.10     2.39   115.89 1.00      740     1110
#> 
#> Draws were sampled using sample(hmc). For each parameter, Bulk_ESS
#> and Tail_ESS are effective sample size measures, and Rhat is the potential
#> scale reduction factor on split chains (at convergence, Rhat = 1).
Code
plot(conditional_effects(fitrt2), points = TRUE)

Code
pp_check(fitrt2)

Multilevel model

Revisiting the data

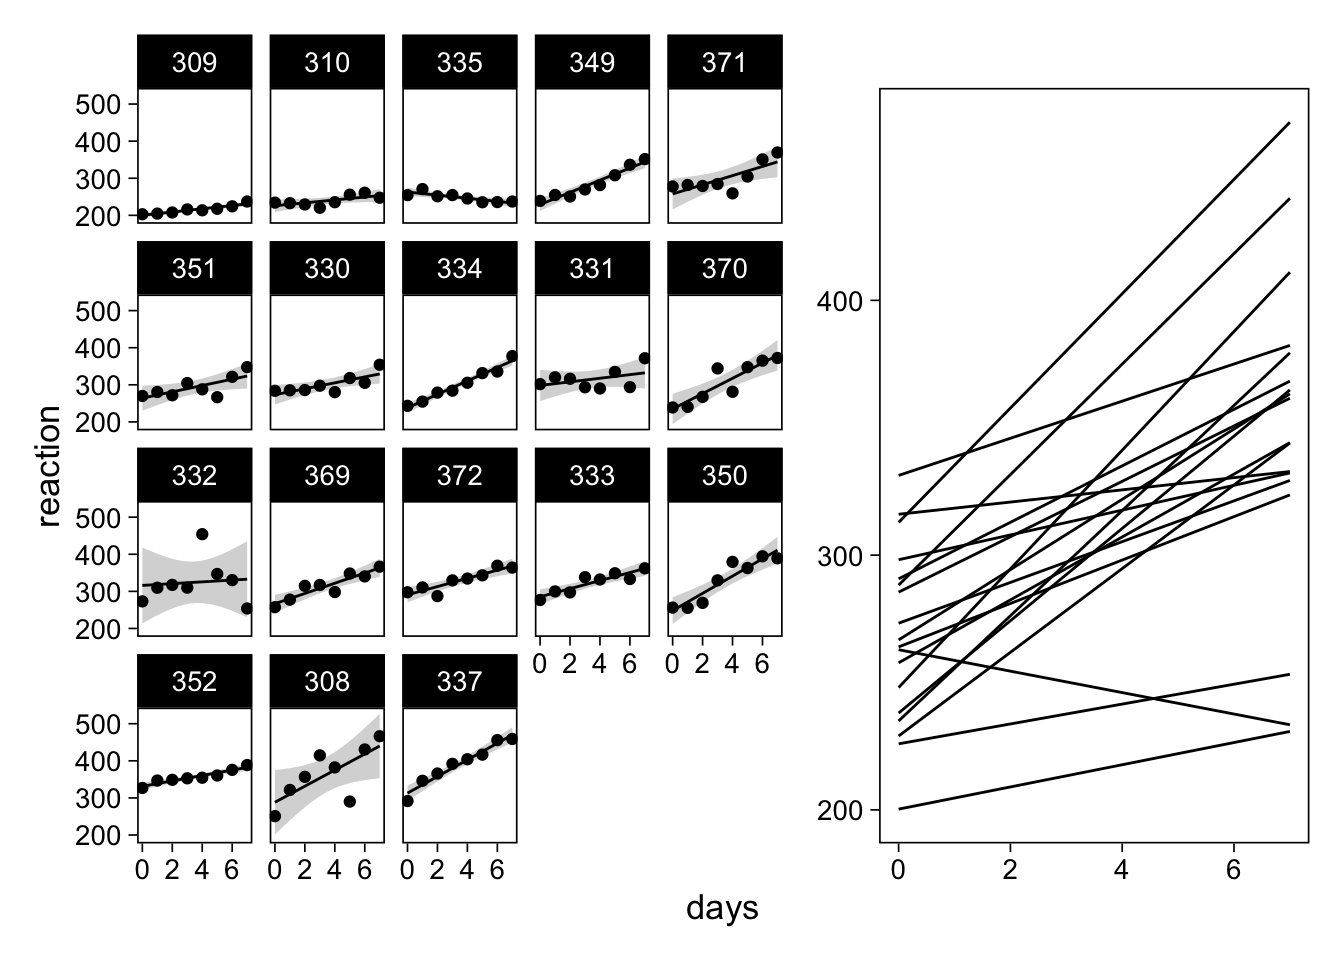
Code
pa <- dat |> 
  mutate(subject = fct_reorder(subject, reaction)) |> 
  ggplot(aes(days, reaction)) +
  geom_smooth(method = "lm", color = "black", linewidth = 0.5) +
  geom_point() +
  facet_wrap("subject")

pb <- dat |> 
  ggplot(aes(days, reaction, group = subject)) +
  geom_smooth(method = "lm", color = "black", linewidth = 0.5, se = FALSE)

(pa | pb) + plot_layout(widths = c(6, 4), axis_titles = "collect")
Figure 7: Scatterplots and a spaghetti plot of reaction times on days of sleep deprivation.

Notation

\[ \begin{aligned} y_{ij} &\sim N\left(\beta_0 + \gamma_{0j} + \left(\beta_1 + \gamma_{1j}\right)x_{ij}, \sigma^2\right), \\ \begin{bmatrix} \gamma_0 \\ \gamma_1 \end{bmatrix} &\sim MVN\left( \begin{bmatrix} 0 \\ 0 \end{bmatrix}, \begin{pmatrix} \tau_0 & \\ \rho &\tau_1 \end{pmatrix} \right). \end{aligned} \tag{1}\]

Code
fitml1 <- brm(
  reaction ~ days + (days | subject),
  data = dat,
  control = list(adapt_delta = .95),
  file = here("models/introduction-ml-1")
)

Notation

\[ \begin{align*} y_{ij} &\sim N(\beta_{0i} + \beta_{1i}x_{ij}, \sigma^2), \\ \beta_{0i} &= \bar{\beta}_0 + u_{0i}, \\ \beta_{1i} &= \bar{\beta}_1 + u_{1i}, \\ \begin{bmatrix} u_{0i} \\ u_{1i} \end{bmatrix} &\sim MVN\left( \begin{bmatrix} 0 \\ 0 \end{bmatrix}, \begin{pmatrix} \tau_0 \ & \\ \rho_{01} \ &\tau_1 \end{pmatrix} \right). \tag{1} \end{align*} \tag{2}\]

Code
fitml2 <- brm(
  bf(
    reaction ~ b0 + b1*days,
    b0 + b1 ~ 1 + (1 |s| subject),
    nl = TRUE
  ),
  data = dat,
  control = list(adapt_delta = .95),
  file = here("models/introduction-ml-2")
)

Interpretation

Code
kable(sm(fitml2))
variable mean sd q2.5 q97.5 pd rhat ess_tail
b_b0_Intercept 267.77 9.2 249.4 285.67 1.00 1 2165
b_b1_Intercept 11.42 2.1 7.3 15.65 1.00 1 2747
sd_subject__b0_Intercept 34.06 8.3 21.1 53.47 1.00 1 2383
sd_subject__b1_Intercept 7.44 1.9 4.4 11.58 1.00 1 2592
cor_subject__b0_Intercept__b1_Intercept 0.18 0.3 -0.4 0.75 0.72 1 2021
sigma 25.98 1.8 22.8 29.97 1.00 1 2587

Priors

Code
get_prior(fitml2)[,-c(5, 6, 9)]
#>                  prior class      coef   group nlpar lb  source
#>                 (flat)     b                      b0    default
#>                 (flat)     b Intercept            b0    default
#>                 (flat)     b                      b1    default
#>                 (flat)     b Intercept            b1    default
#>   lkj_corr_cholesky(1)     L                            default
#>                 (flat)     L           subject          default
#>  student_t(3, 0, 65.5)    sd                      b0  0 default
#>  student_t(3, 0, 65.5)    sd                      b1  0 default
#>                 (flat)    sd           subject    b0    default
#>                 (flat)    sd Intercept subject    b0    default
#>                 (flat)    sd           subject    b1    default
#>                 (flat)    sd Intercept subject    b1    default
#>  student_t(3, 0, 65.5) sigma                          0 default
  • What do you think?

References

Gelman, Andrew, John B. Carlin, Hal S. Stern, David B. Dunson, Aki Vehtari, and Donald B. Rubin. 2013. Bayesian Data Analysis, Third Edition. Boca Raton: Chapman; Hall/CRC.
Gelman, Andrew, Aki Vehtari, Daniel Simpson, Charles C. Margossian, Bob Carpenter, Yuling Yao, Lauren Kennedy, Jonah Gabry, Paul-Christian Bürkner, and Martin Modrák. 2020. “Bayesian Workflow.” November 3, 2020. https://doi.org/10.48550/arXiv.2011.01808.
Kruschke, John K. 2014. Doing Bayesian Data Analysis: A Tutorial Introduction with R. 2nd Edition. Burlington, MA: Academic Press.
McElreath, Richard. 2020. Statistical Rethinking: A Bayesian Course with Examples in R and Stan. 2nd ed. CRC Texts in Statistical Science. Boca Raton: Taylor; Francis, CRC Press.